Race- and Gender-Neutral Damages: A Survey of the Recent Forensic Economics Literature
October 30, 2026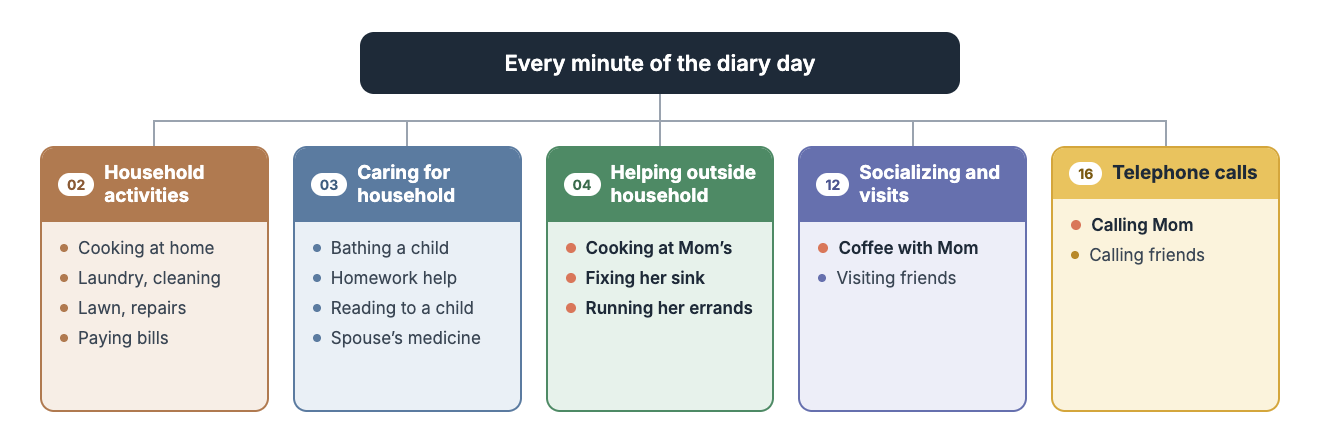
Many damages claims rest on a simple question: how much time did this person spend doing something that now will not get done? A mother cooked, drove, and helped with homework. A son mowed his widowed father’s lawn and called him every evening. A spouse managed the bills and the repairs. When an injury or death ends that work, forensic economists put a number on it.
The family’s own account is a natural starting point, but it is hard to test or rely upon as the single source of input when quantifying such damages. What a jury needs is a neutral yardstick: how much time people like this person actually spend on these tasks.
For more than two decades, that yardstick has been the American Time Use Survey (ATUS). This post is the first in a series on what statistics ATUS data can and cannot provide for litigation. We explain how the survey works, how its data is organized, and where it fits in a damages analysis. Later posts apply it to household services, eldercare, childcare, and advice and companionship.
ATUS and Time Diaries
ATUS is a federal survey run by the U.S. Census Bureau for the Bureau of Labor Statistics (BLS). It has been collected every month since January 2003. Each month, one person age 15 or older is chosen from each sampled household. These households have just finished their time in the Current Population Survey, the government’s main labor-force survey, so a rich set of background facts on each person is already on file (Hamermesh, Frazis & Stewart, 2005). The sample is large, the merged 2003–2025 micro data files hold more than 250,000 diaries.
The heart of ATUS is a 24-hour time diary. A trained interviewer calls the respondent and walks through the previous day, from 4 a.m. to 4 a.m. For each activity, the interviewer records:
- What the person did, in their own words, later coded into a detailed activity list;
- When it started and how long it lasted;
- Where it happened (home, workplace, a car, someone else’s home); and
- Who was there (a spouse, a child, a parent, a friend, or no one).
Because every minute of the day must be accounted for, the diary leaves little room for the guesswork that inflates answers to “how many hours a week do you usually spend on…” questions. Weekend days are deliberately oversampled so that Saturdays and Sundays are well measured, and survey weights restore the right balance when we compute averages. Figure A shows what a single diary day looks like.
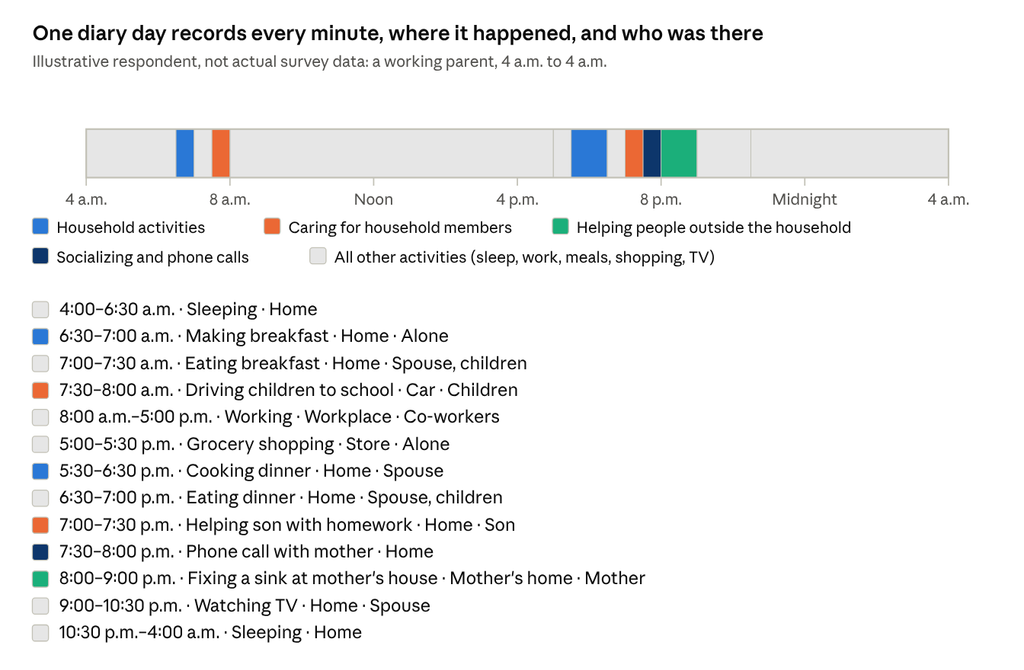
Figure A. A sample diary day, 13 episodes.
BLS publishes summary tables each year, and much forensic work relies on them or on commercial compilations built from them. But the published tables group people broadly. They rarely match the person in a given case: a 52-year-old man who works full time, lives alone, and has a parent in the same town.1
To match that person, an economist has to work with the microdata, the person-level records behind the tables. BLS releases these as a set of linked files, each organized at a different level of detail (see Figure B below):
- Respondent file: one row per person, with work status, earnings, and the survey weights.
- Activity Summary file: one row per person, with total minutes spent on each type of activity that day.
- Activity file: one row per episode in the diary, with start time, end time, activity code, and location.
- Who file: one row for each person present during each episode.
- Roster file: one row per household member, with age, sex, and relationship to the respondent.
- ATUS-CPS file: the background facts carried over from the Current Population Survey.
- Eldercare Roster file (2011 onward): one row for each person the respondent cares for because of aging.
Every file shares the same case ID, so the pieces can be joined. That is what makes targeted questions possible. For example: among men who live alone, how many minutes on an average day are spent helping a parent who lives elsewhere, and how many of those minutes are spent in the parent’s home? BLS now releases these files pooled across 2003 to 2025, and we have built our own estimation tools on the full 23-year set. Pooling years gives samples large enough to match a specific plaintiff’s profile and still produce stable estimates.
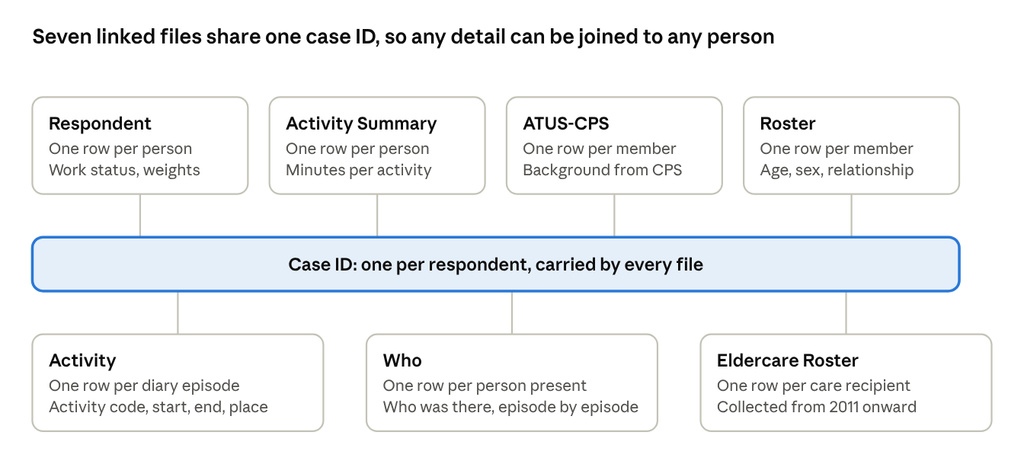
Figure B. The ATUS microdata file structure.
Minutes by Activity Category
Each diary entry is coded into a three-level activity list with 17 major categories and hundreds of detailed codes. Three features of this coding matter most in litigation (Figure C below).
First, every minute goes into exactly one category. The diary records the main thing the person was doing. Cooking dinner while a child plays nearby is coded as food preparation. Because each minute is counted once, categories can be added together without double counting, a concern raised often in the forensic literature (Ireland, 2014).
Second, the code depends on whom the work was for. The same task lands in different categories depending on the household:
- Cooking dinner in one’s own home is a household activity.
- Bathing a child or helping a spouse with medication is caring for household members.
- Cooking a meal in an elderly mother’s separate home is caring for and helping non-household members.
- Visiting that mother for coffee is socializing and communicating; calling her is a telephone call.
This split is what lets us separate, for example, the services a man provided to his own household from the help he gave a parent across town. Each can be a separate element of loss, and each belongs to a different claimant.
Third, travel follows its purpose. Driving a child to practice is coded as travel related to caring for household children, not as general driving. A loss estimate can include it or leave it out, but it is never lost in a catch-all “travel” bucket.
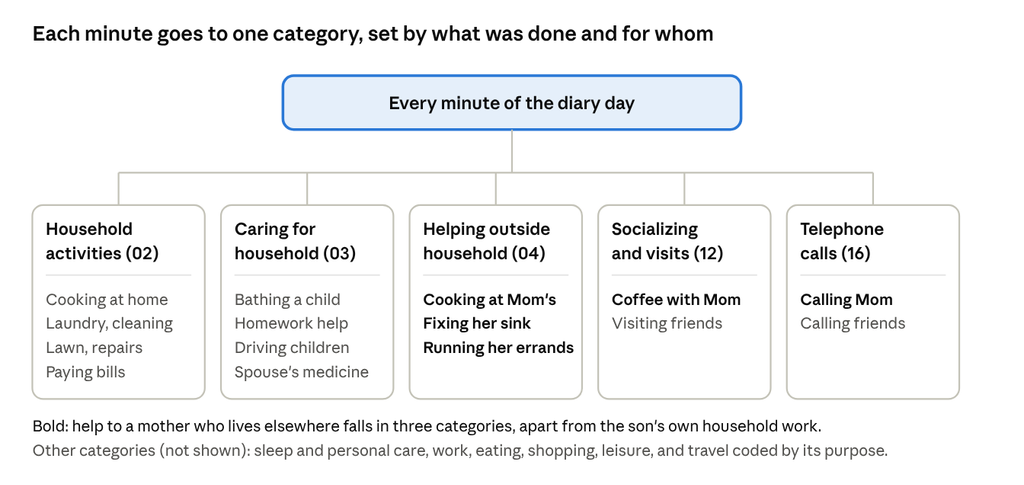
Figure C. The main primary activity categories most used in damages work (by major-category codes)
Per activity vs per participant distinction
ATUS results come in three related numbers, and confusing them is one of the most common errors in a household services report (Figure D):
- Participation rate: the share of people in the group who did the activity on the diary day.
- Average for participants: the average time spent by those who did it.
- Average for everyone: the average across the whole group, counting zeros for those who did not.
The three are linked by a simple rule: participation rate × average for participants = average for everyone.
A simple illustration (numbers are for illustration only): suppose 20% of men in a group did lawn work on an average day, and those who did spent 2 hours. The average for everyone is 0.2 × 2 = 0.4 hours a day, or 2.8 hours a week.
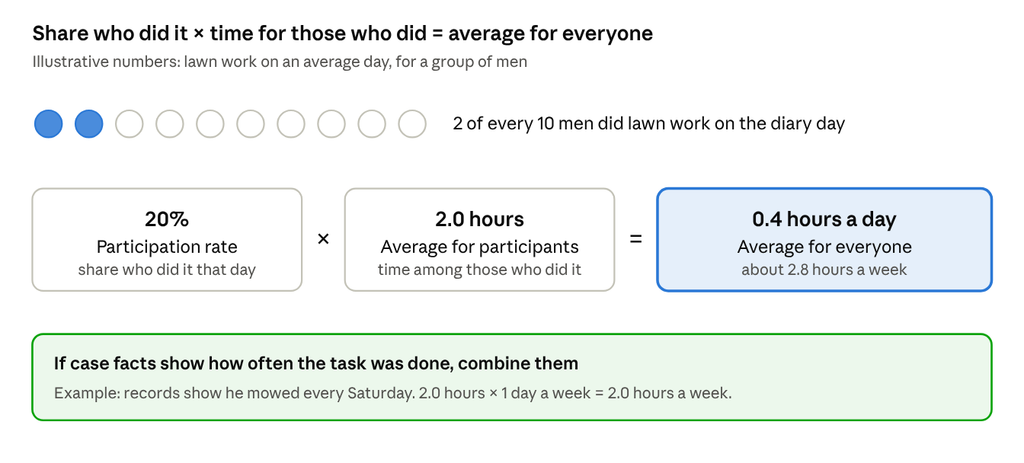
Figure D. Activity vs Participant
The key for the forensic economist is to be explicit about what she knows about the frequency with which such activity took place for the plaintiff that got injured or passed away. If the evidence shows that the plaintiff did yard work every Saturday, the group-wide average may understate his loss. The right number depends on the facts, and this is where frequency evidence comes in. ATUS tells us how long a task takes on a day it is done. Other surveys, such as those by the Pew Research Center, tell us how often people do it. Our next post shows how the two fit together.
Advantages of Using ATUS Time Diaries for Litigation Work
There are two ways to ask people about their time. A stylized question asks for a typical amount: “How many hours a week do you spend on housework?” A diary asks what the person did yesterday, minute by minute. Decades of research find that diaries are the more reliable of the two. Stylized questions ask respondents to recall many days and average them in their heads, which invites error and a pull toward socially desirable answers (Juster, Ono & Stafford, 2003; Kan & Pudney, 2008). In one well-known comparison, survey questions produced housework estimates about 50% higher than diaries for the same population, although both showed the same gap between men and women (Bianchi, Milkie, Sayer & Robinson, 2000).
Forensic economists recognized the value of ATUS almost as soon as it appeared. Ward (2007) described it as the first large federal source that lets an expert measure the hours a decedent spent on services such as childcare, instruction, and home maintenance, rather than relying on survivor recall alone. Since then, ATUS has been used to measure maternal household services by the age and number of children (Baum & Rodgers, 2018), the share of household services a decedent consumed personally (Christensen, 2022), and the services of people with disabilities (Crouse, 2014). Others have built valuation methods on top of ATUS hours (Lowen & Sicilian, 2015; Sims, 2025).
The most common route into court is The Dollar Value of a Day, an annual compilation that pairs ATUS hours with market wages. Rogers and Ward (2025) describe it as the single most widely used source of household-service figures among forensic economists. Periodic surveys of forensic experts confirm that published compilations and ATUS microdata are the standard tools of the field (Schap, Luthy & Rosenbaum, 2020; Rosenbaum, Garagulagian & Angerstein-Gaines, 2025).
The literature is also candid about limits. Ireland (2011) warns that a group average is not binding on any one plaintiff, and that some activities of retirees look more like hobbies than household work. Critics argue that diaries miss “on-call” time, such as a parent’s protective presence at night. These are reasons to use ATUS carefully, not reasons to set it aside. They are also why we work from the microdata rather than from published averages.2
Forensic Applications of ATUS include:
- Lost household services. Hours of cooking, cleaning, yard work, repairs, and household management an injured or deceased person would have provided.
- Childcare and parental guidance. Time a parent spent caring for, teaching, and driving children, by the children’s ages.
- Eldercare. Care an adult child or spouse gave to an aging relative, measured by a special ATUS module since 2011.
- Help to family outside the home. Errands, repairs, and housework done for parents, adult children, or other relatives who live elsewhere.
- Companionship and advice. Time spent with, talking to, and calling specific family members, using the record of who was present.
- Life care planning. A baseline for how much help an injured person needs to replace tasks they once did themselves.
- Testing claims. A check on whether a plaintiff’s own account of time spent is in line with people of similar age, sex, work status, and household.
- Employment matters. Time spent working at home, commuting, and traveling for work.
- Family law. How household and childcare work was divided between spouses.
Each use asks a slightly different question of the data. Getting the question right, and building the estimate from records that match the person in the case, is most of the work.
What Comes Next
The next posts in this series apply ATUS to specific losses covering household services, eldercare, childcare, and advice, guidance and counsel between family members.
IAMECON builds time-use estimates from the full ATUS microdata spanning 2003-2025, matched to the facts of each case. If you have a matter involving household services, care, or advice and counsel losses, contact us to discuss how the data applies.
Main Author: Devrim Ikizler, PhD
References
- Baum, C. L., II, & Rodgers, J. D. (2018). Maternal Household Services and Children. Journal of Forensic Economics, 27(1), 1–15.
- Bianchi, S. M., Milkie, M. A., Sayer, L. C., & Robinson, J. P. (2000). Is Anyone Doing the Housework? Trends in the Gender Division of Household Labor. Social Forces, 79(1), 191–228.
- Christensen, E. W. (2022). Personal Consumption of Household Services. Journal of Forensic Economics, 30(1), 31–61.
- Crouse, J. T. (2014). The Impact of Disability on Household Services: Evidence from the American Time Use Survey. The Rehabilitation Professional, 22(4), 217–222.
- Frazis, H., & Stewart, J. (2012). How to Think About Time-Use Data: What Inferences Can We Make About Long- and Short-Run Time Use from Time Diaries? Annals of Economics and Statistics, 105/106, 231–245.
- Hamermesh, D. S., Frazis, H., & Stewart, J. (2005). Data Watch: The American Time Use Survey. Journal of Economic Perspectives, 19(1), 221–232.
- Ireland, T. R. (2011). Uses of the American Time Use Survey to Measure Household Services: What Works and Does Not Work. Journal of Legal Economics, 18(1), 63–79.
- Ireland, T. R. (2014). Evaluation of Household Services by Forensic Economists and Life Care Planners: Core Concepts and Avoidance of Double Counting. The Rehabilitation Professional, 22(2), 71–82.
- Juster, F. T., Ono, H., & Stafford, F. P. (2003). An Assessment of Alternative Measures of Time Use. Sociological Methodology, 33, 19–54.
- Kan, M. Y., & Pudney, S. (2008). Measurement Error in Stylized and Diary Data on Time Use. Sociological Methodology, 38.
- Lowen, A., & Sicilian, P. (2015). An Alternative Valuation Method for Household Production Using American Time Use Survey Data. Journal of Legal Economics, 22(1), 1–23.
- Rogers, W. H., & Ward, J. O. (2025). The Dollar Value of a Day through Two Decades. Journal of Legal Economics, 31(1–2), 169–183.
- Rosenbaum, D. I., Garagulagian, R., & Angerstein-Gaines, M. (2025). A 2024 Survey of Forensic Experts: Their Methods, Estimates, and Perspectives. Journal of Legal Economics, 31(1–2), 5–36.
- Schap, D., Luthy, M. R., & Rosenbaum, D. I. (2020). A 2019 Survey of Forensic Experts: Their Methods, Estimates, and Perspectives. Journal of Legal Economics, 26(1–2), 23–69.
- Sims, J. M. (2025). A Refined Household Service Value. Journal of Legal Economics, 31(1–2), 139–167.
- Ward, J. O. (2007). Time Valuation as an Alternative to Lost Enjoyment of Life in Determining Wrongful Death Damages. Journal of Forensic Economics, 20(2), 155–169.
- Note that this information is not available at ATUS, but available in other databases, which will be discussed later.
- Limits to keep in mind. ATUS records a single day for each respondent and does not follow people over time, so it describes groups well but not any one person’s routine; frequency data from other surveys helps fill that gap (Frazis & Stewart, 2012). Only the main activity is coded, so tasks done alongside something else, such as watching a child while cooking, are only partly captured. Data collection paused for part of spring 2020, and that year carries its own weights; we treat it separately. Time use also shifts over two decades.