
The American Time Use Survey in Litigation: A General Perspective
November 11, 2026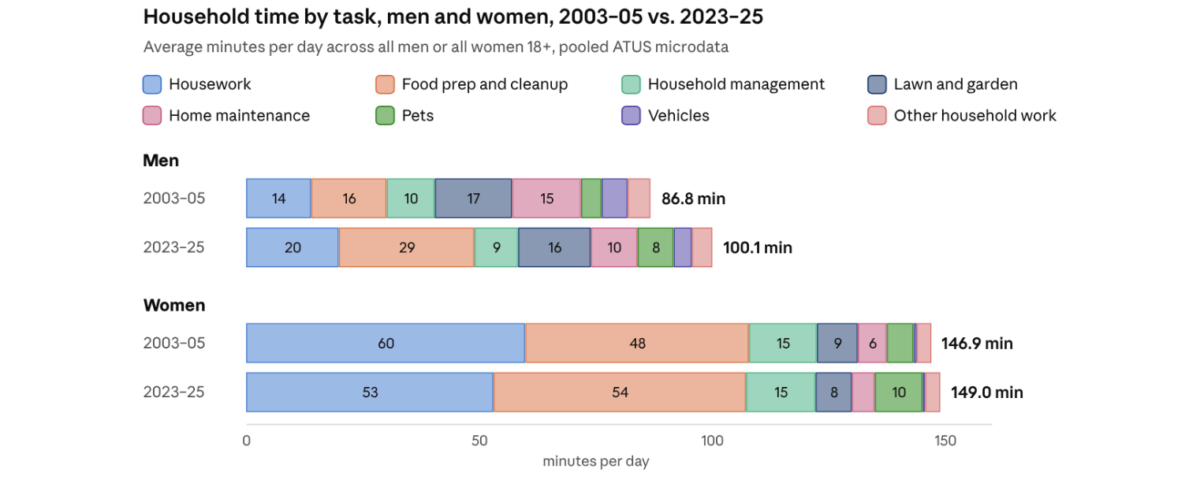
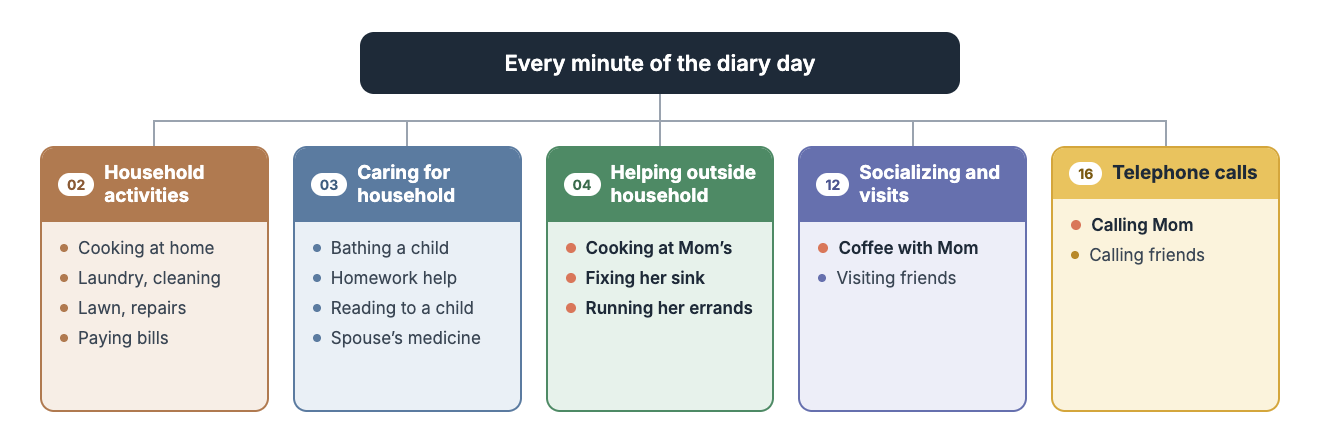
In our first post, we described how the American Time Use Survey (ATUS) records a full day, minute by minute, for a large national sample. This post turns to one of the most common uses of that data in litigation: estimating the household services a person provided before an injury or death.
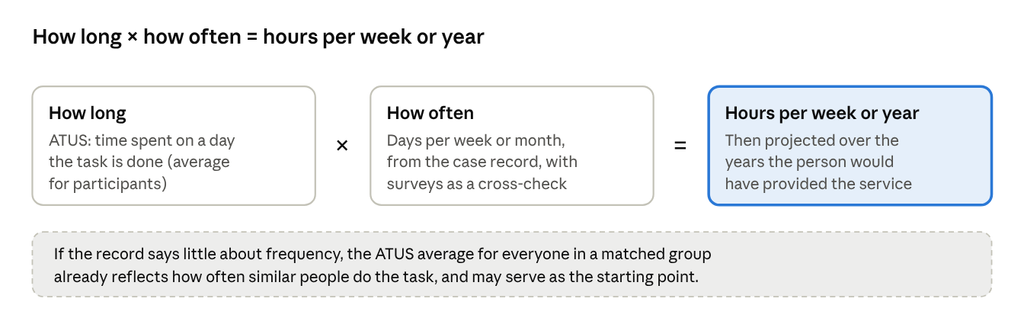
A household services estimate usually rests on two questions. The first is how long: when a person cooks, cleans, mows, or makes repairs, how much time does the task take? The second is how often: on how many days a week or a month is the task done? ATUS speaks most directly to the first question. The second is often best answered by the facts of the case, and other survey data on frequency can help put those facts in context.
Below we describe which ATUS categories are commonly considered, how duration and frequency can be combined, and how time spent on household work has changed between 2003 and 2025.
Which ATUS Categories Make Up “Household Services”?
ATUS does not have a single category called household services. Instead, analysts assemble one from several activity groups. The core group is household activities, the work people do to keep their own home running. Depending on the case, related categories may also be relevant.
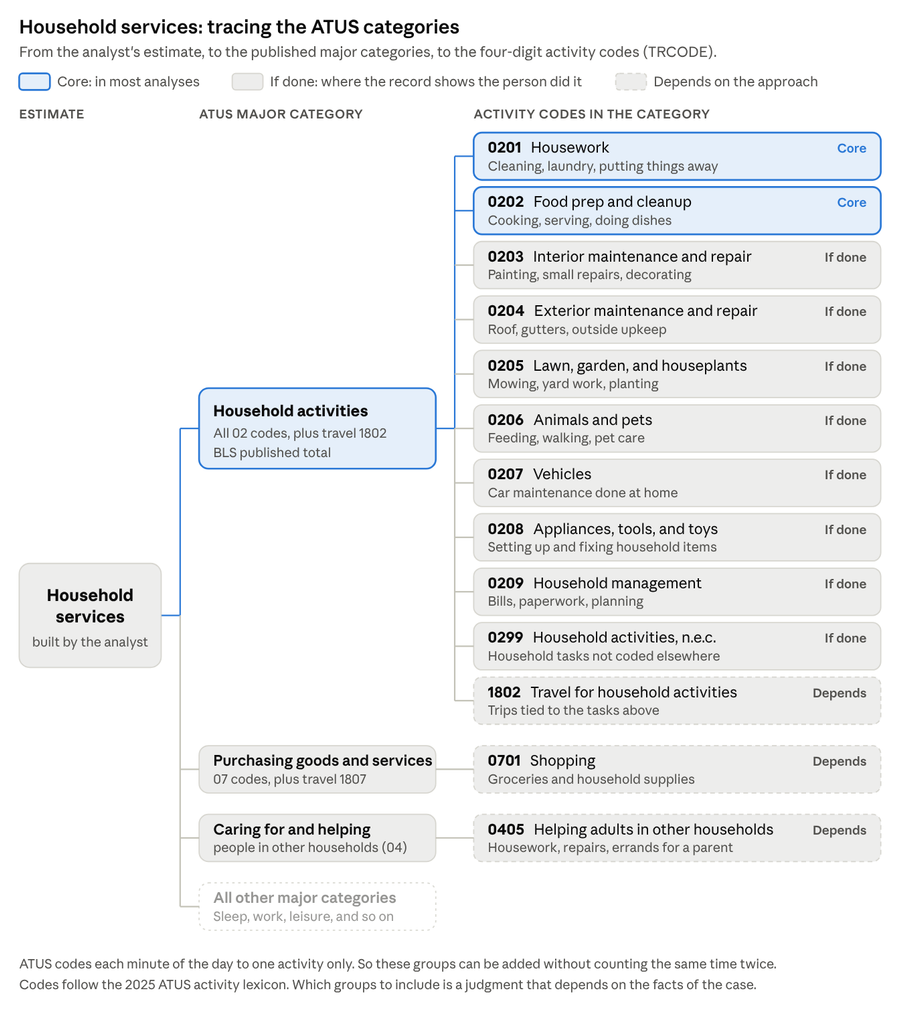
Figure A: ATUS category tree for household services · major categories and activity codes
Because ATUS assigns each minute to a single category, these groups can be added without counting the same time twice (Ireland, 2014). Which groups belong in a given estimate is a judgment that depends on the household, the claimants, and the record. In a wrongful death case, for example, some jurisdictions also call for an adjustment for the share of services the decedent consumed personally, and recent research uses ATUS to estimate that share (Christensen, 2022).
How Long vs. How Often
Because each respondent reports a single day, ATUS describes groups well but cannot say how often any one person did a task (Frazis & Stewart, 2012). It reports how many people in a group did an activity on an average day, and how long they spent on the days they did it. Turning that into a weekly or annual figure for a specific person is a separate step, sometimes described as moving from general population data to the individual plaintiff (Slesnick, 2022).
Frequency information can come from several places:
- The case record. Testimony, schedules, receipts, or photographs may show that a person mowed weekly, cooked most nights, or visited a parent every Sunday.
- The ATUS participation rate itself. For a broad group, the share doing a task on an average day is an estimate of how often people like this do it.
- Other surveys. The Pew Research Center asks adults how often they help family members. In a 2025 survey, among adults whose parents age 65 or older needed help with errands, housework, or home repairs, about 35% said they help on a regular basis and 44% from time to time (Pew Research Center, 2026). An earlier Pew survey found that 58% of adults with a parent 65 or older had helped with such tasks in the past year (Pew Research Center, 2015).1
Survey answers like “regularly” or “from time to time” are not exact counts of days. They are better suited to checking whether a frequency drawn from the record is reasonable than to replacing it. The Diagram below shows how the pieces can fit together.
How Household Time Has Changed, 2003 to 2025
Time use is not fixed. Over the two decades ATUS has been collected, the mix of household work has shifted, especially between men and women. The chart below uses our pooled ATUS microdata. It compares the average minutes per day men and women spent on each household task in 2003–05 and in 2023–25.
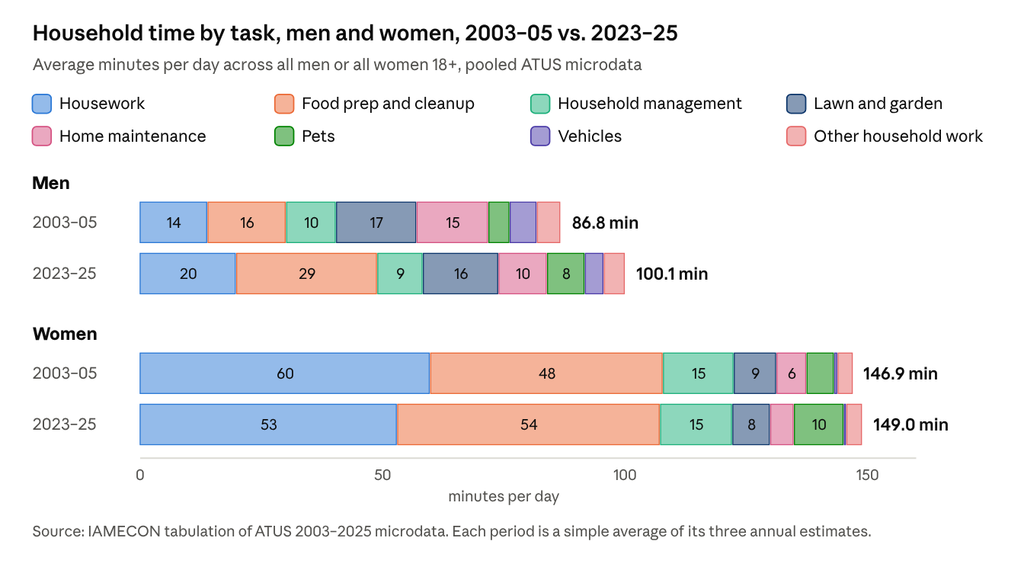
A few patterns stand out. Men’s total household time rose from about 87 to about 100 minutes a day. Most of the gain came from food preparation and cleanup, which rose from about 16 to about 29 minutes a day. This is also documented by other scholars (Ewoldt et al., 2025). Men’s housework time also rose, while their time on home maintenance fell. Women’s total changed little, from about 147 to about 149 minutes a day, but the mix shifted. Their housework time fell from about 60 to about 53 minutes a day, continuing a pattern documented in earlier time diary studies (Bianchi et al., 2000). Their food preparation time rose from about 48 to about 54 minutes. For both men and women, time on pets rose and lawn and garden care changed little.
The averages can move for different reasons. The share of men doing any household activity on an average day rose from 62.5% in 2003 to 74.9% in 2025, while the time spent by men on the days they did such work stayed near 2.1 hours in both years. In other words, more men took part, but those who took part did not spend much longer. This is one reason the choice between an average for everyone and an average for those who did the work can matter.
These are national averages. Trends for a particular group, such as married men in their fifties who work full time, can differ, and our pooled 2003–2025 microdata allow those trends to be examined directly. Whether a recent period or a longer pooled period better fits a given case is a question the evidence can help answer.
Letting the Facts of the Case Guide the Choices
There is no single correct way to build a household services estimate from ATUS. Several choices are best made in light of the evidence:
- Which average to use. The average for everyone in a group already reflects how often people in that group do a task. The average for those who did it reflects time on a doing day. Where the record shows how often the person did the work, the second may combine naturally with that frequency. Where it does not, the first may be the more natural starting point.
- Which group to match. Age, sex, work status, marital status, and the presence and ages of children all affect household time (Baum & Rodgers, 2018). Pooling many years of ATUS allows narrower matches while keeping samples large enough to be reliable.
- Which categories to include. As the diagram above shows, some categories apply in nearly every case, and others only where the evidence supports them.
- Which years to rely on. Where time use has shifted, recent years may describe the present better. Where it has not, pooling more years adds precision.
- How to value the hours. Replacement-cost methods differ in the wages they apply, and the forensic literature continues to refine them (Lowen & Sicilian, 2015; Sims, 2025; Rogers & Ward, 2025).
Each of these is a judgment the analyst should be able to explain and support with the record. ATUS provides the national benchmark; the facts determine how it applies.
What Comes Next
Our next post turns to eldercare: the help adult children and spouses give to aging family members, measured by a special ATUS module since 2011, and how often that help is given.
IAMECON builds household services estimates from the full 2003–2025 ATUS microdata, matched to the facts of each case. If you have a matter involving lost household services, contact us to discuss how the data may apply.
Main Author: Devrim Ikizler, PhD
References
- Baum, C. L., II, & Rodgers, J. D. (2018). Maternal Household Services and Children. Journal of Forensic Economics, 27(1), 1–15.
- Bianchi, S. M., Milkie, M. A., Sayer, L. C., & Robinson, J. P. (2000). Is Anyone Doing the Housework? Trends in the Gender Division of Household Labor. Social Forces, 79(1), 191–228.
- Bureau of Labor Statistics. American Time Use Survey news releases, Table 1, for 2003, 2013, 2019, and 2025.
- Christensen, E. W. (2022). Personal Consumption of Household Services. Journal of Forensic Economics, 30(1), 31–61.
- Ewoldt, L., Ng, S. W., Popkin, B. M., & Taillie, L. S. (2025). Trends in Home Cooking among United States Adults from 2003 to 2023. Verify journal and volume.
- Frazis, H., & Stewart, J. (2012). How to Think About Time-Use Data. Annals of Economics and Statistics, 105/106, 231–245.
- Ireland, T. R. (2014). Evaluation of Household Services by Forensic Economists and Life Care Planners: Core Concepts and Avoidance of Double Counting. The Rehabilitation Professional, 22(2), 71–82.
- Lowen, A., & Sicilian, P. (2015). An Alternative Valuation Method for Household Production Using American Time Use Survey Data. Journal of Legal Economics, 22(1), 1–23.
- Pew Research Center. (2015). Family Support in Graying Societies.
- Pew Research Center. (2026). Family Caregiving in an Aging America. Survey conducted September 2–8, 2025.
- Rogers, W. H., & Ward, J. O. (2025). The Dollar Value of a Day through Two Decades. Journal of Legal Economics, 31(1–2), 169–183.
- Sims, J. M. (2025). A Refined Household Service Value. Journal of Legal Economics, 31(1–2), 139–167.
- Slesnick, F. (2022). G2i, Translating General Population Data to the Individual Plaintiff. Journal of Legal Economics, 28(2).