The American Time Use Survey (ATUS) in Litigation: Measuring Lost Household Services
November 11, 2026The American Time Use Survey (ATUS) in Litigation: Eldercare — Frequency, Duration, and Recipients
In our previous post, we looked at household services: the work people do to keep their own home running. Many people also help someone else. They drive a parent to the doctor, cook for a spouse who can no longer manage, or check in on an elderly neighbor. When an injury or death ends that help, its loss may become part of a damages claim.
The same two questions apply: how long does the help take, and how often is it given? Eldercare is the one area where the American Time Use Survey (ATUS) answers both. Since 2011, ATUS has asked caregivers how often they give care, and it records the time they spent on care during their diary day. This post uses our pooled 2011–2025 ATUS microdata: 146,916 respondents age 15 and older, of whom 25,276 were caregivers.
The Data
ATUS first asks whether, in roughly the past three to four months, the person gave unpaid care to an adult who needed help because of a condition related to aging. Caregivers then say how often they helped, from daily to once a month. Those who helped more than once describe each person they cared for and mark which activities on their diary day were eldercare.
The Bureau of Labor Statistics (BLS) counts care only for people 65 and older, and it reports that 14% of people aged 15 and older gave such care in 2023–2024 (BLS, 2025). Counting care for any adult who needed help because of aging, and leaving out one-time help, gives 16.9% in our pooled data.
Frequency and Duration of Help
Caregivers differ most in how often they help. About 23% help daily and another 24% several times a week. The rest help once a week or less. Daily caregivers average about 19 hours of eldercare a week, roughly 1,000 hours a year. Every other group averages under 5 hours a week. The average for all caregivers, 6.4 hours a week, sits between very different groups.
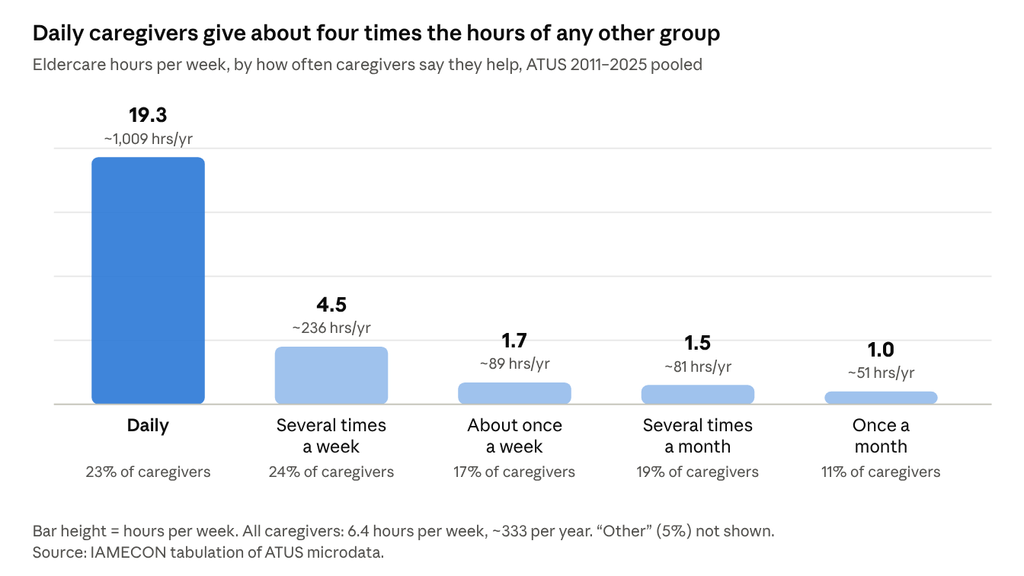
Figure A · Eldercare hours by frequency of care, ATUS 2011–2025 pooled
The diary and the frequency answers line up. People who said they help several times a week gave care on about 2 days in 7, and those who said about once a week on about 1 day in 7. On days when care was given, it took about 3 hours on average.
One limit applies to every diary number. Each person reports a single day, so these figures are averages across many people, not one person’s pattern. The caregiver’s own answer to the frequency question is the only person-level measure of how often. Analysts often convert those answers to days per week and multiply by time per care day. Survey data can serve as a check: Pew found that among adults whose aging parents needed help, about 35% helped on a regular basis and 44% from time to time (Pew Research Center, 2026).
The Recipient and Their Residence
Most eldercare goes to family who live elsewhere. Parents make up 38% of care recipients, parents-in-law 9%, grandparents 11%, friends and neighbors 17%, and spouses 6%. Only 16% of recipients live with the caregiver, and 47% are 80 or older.
Where the recipient lives matters more than anything else. The chart shows caregivers who cared for one person.
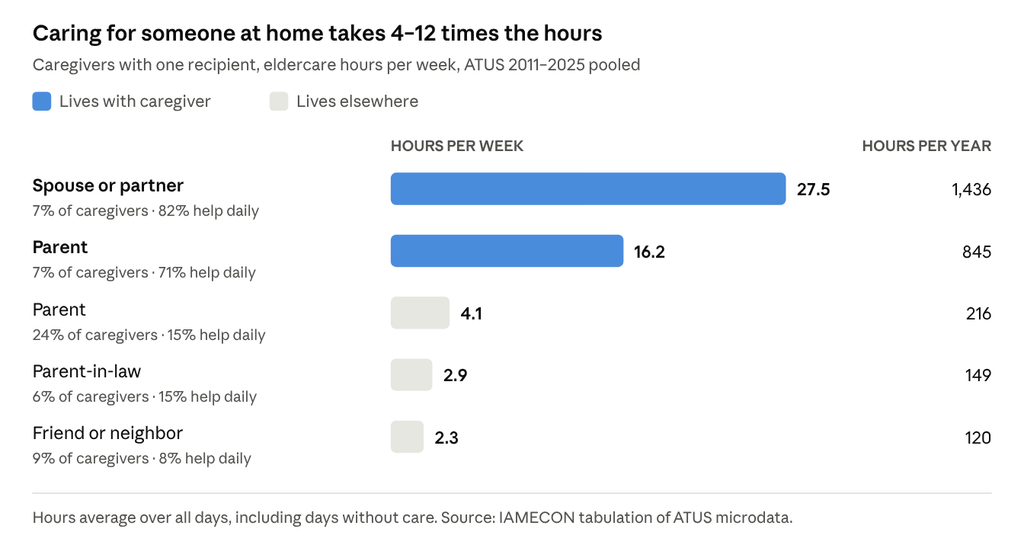
Figure B · Eldercare hours by who receives care and where they live, ATUS 2011–2025 pooled
A spouse caring for a partner at home looks very different from an adult child helping a parent across town. The second pattern is the most common one, at about a quarter of all caregivers.
Categories of Eldercare
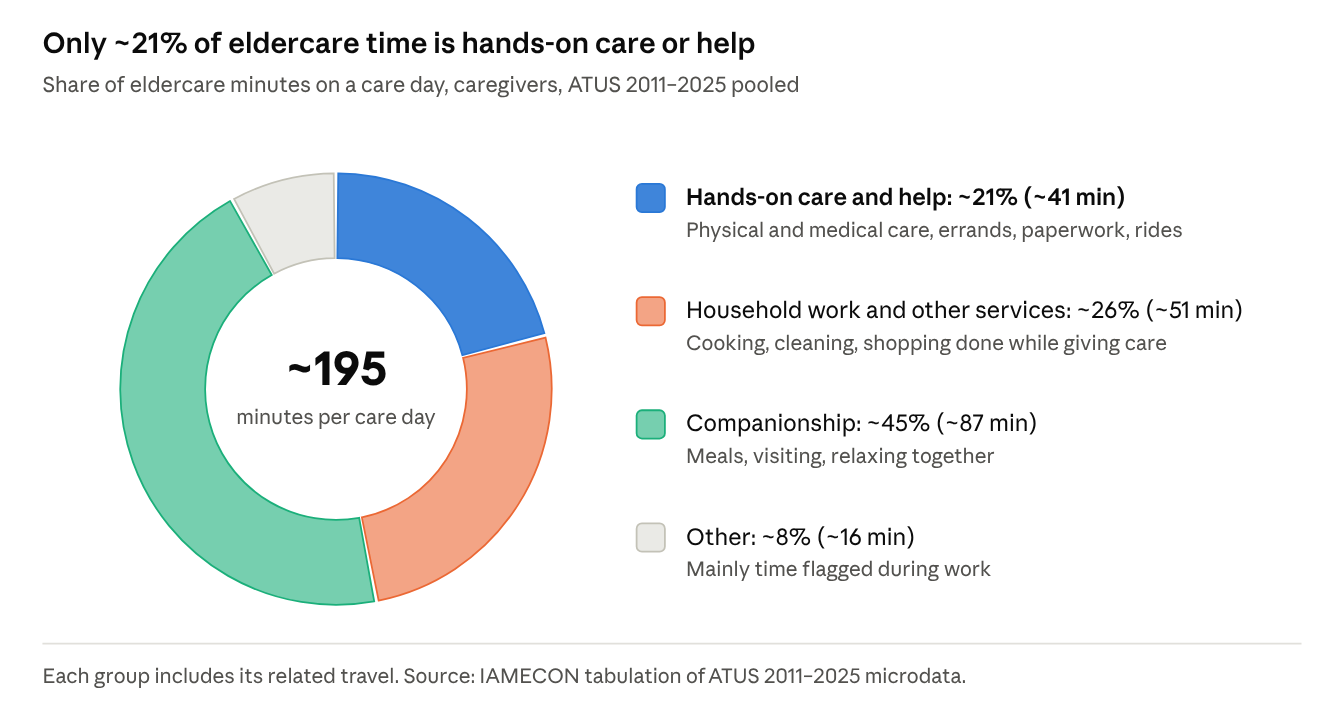
Eldercare is often not a separate task. On a typical care day, caregivers log about 195 minutes of eldercare. Only about 41 of those minutes, or 21%, are hands-on care and help, such as physical care, errands, paperwork, and rides. About 26% is household work and other services done while giving care, and about 45% is companionship: meals, visiting, and relaxing together.
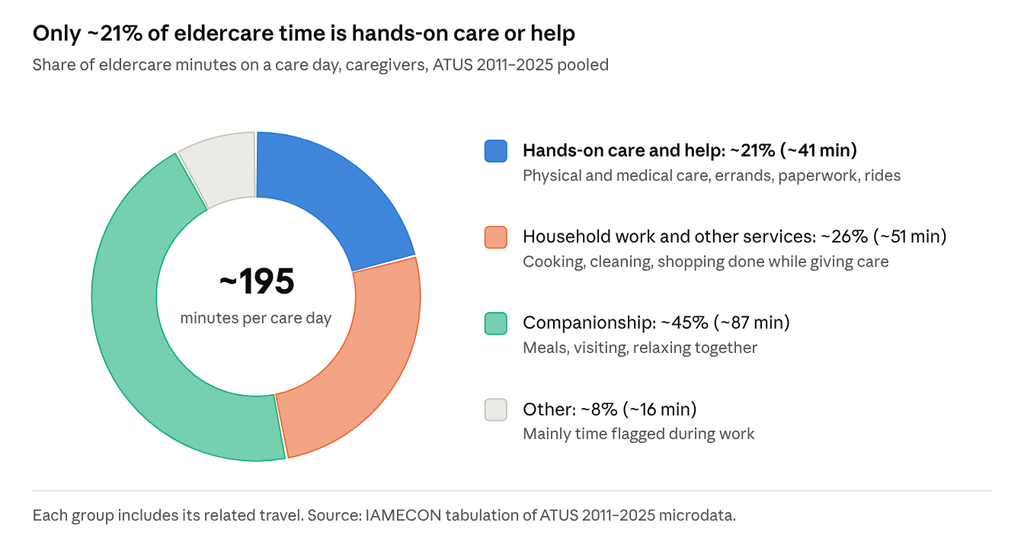
Figure C · Eldercare minutes in four groups, ATUS 2011–2025 pooled
Counting only hands-on care, or every eldercare minute, gives results about five times apart when measuring elderly help. Either can be combined with how often the person gave care. The data shows that much of eldercare time is spent being with the person. Whether that time is valued as a service, and at what rate, is a legal and factual question. About 21% of eldercare minutes are household activities, the same codes a household services estimate counts. On care days, about 27% of caregivers’ household-activity minutes are also flagged as eldercare. An estimate that adds eldercare on top of household services can measure and remove that overlap.
Trends in Eldercare: 2011–2025
Two trends run in opposite directions. The share of people who are caregivers fell, from about 18% in 2011–2016 to about 15% to 16% in 2021–2025. Over the same years, caregivers gave more time. Their eldercare rose from about 5.5 to about 8 hours a week, and the share who help daily rose from about 21% to about 26%. Fewer people are giving care, and those who do are giving more of it.
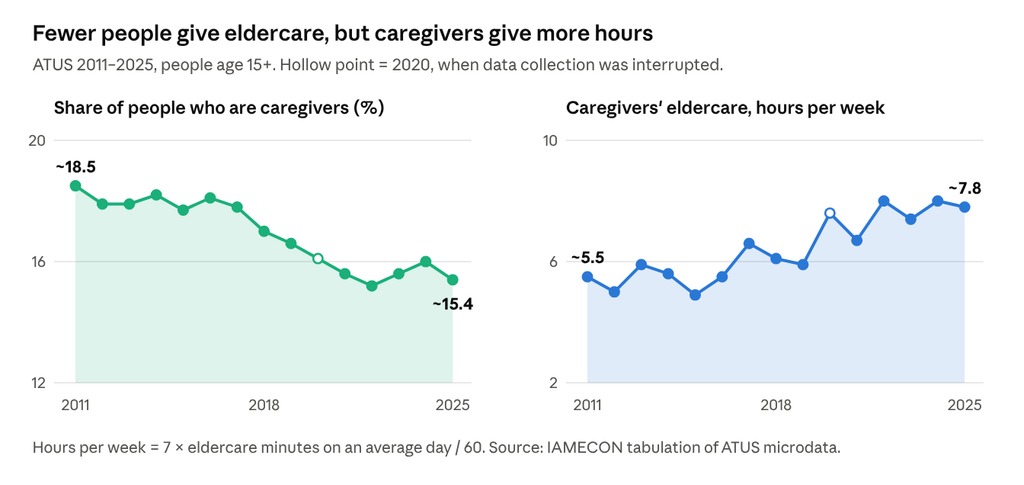
Figure D · Eldercare trends, ATUS 2011–2025 annual estimates
The data do not say why. For an estimate, the trend raises a practical choice. Recent years may describe current caregiving better, while pooling all years gives larger samples for narrow groups. Some analysts also leave out 2020, when data collection was interrupted.
Other Findings in Brief
Caregiving peaks at ages 45 to 64, when 23% of people are caregivers, and 26% of women in that age group. Caregivers 65 and older give the most time, about 12 hours a week. Full-time workers give fewer hours, about 3.6 a week.
For 62% of recipients, care had gone on for more than a year at the interview. Among those, the median so far was 4 years. These figures measure care so far, not its full length, and long spells are more likely to be caught in progress.
Letting the Facts of the Case Guide the Choices
There is no single correct way to build an eldercare estimate from ATUS. The main choices are which definition of caregiving to use, whether to use the average for caregivers or for everyone in a matched group, which group to match (above all, where the recipient lives), how to measure how often care was given, whether to count only hands-on care or all eldercare time, how to handle overlap with household services, and which years to rely on. Each is a judgment the analyst should be able to explain and support with the record (Frazis & Stewart, 2012). ATUS provides the national benchmark; the facts determine how it applies.
Our next post turns to childcare: the time parents spend caring for children, and how it changes as children grow.
IAMECON builds eldercare and household services estimates from the full ATUS microdata, matched to the facts of each case. If you have a matter involving lost care or services, contact us to discuss how the data may apply.
Main Author: Devrim Ikizler, PhD
References
- Bureau of Labor Statistics. (2025). Unpaid Eldercare in the United States — 2023–2024 Data (USDL-25-1462).
- Frazis, H., & Stewart, J. (2012). How to Think About Time-Use Data. Annals of Economics and Statistics, 105/106, 231–245.
- Pew Research Center. (2026). Family Caregiving in an Aging America. Survey conducted September 2–8, 2025.
Data: IAMECON tabulations of ATUS 2011–2025 multi-year microdata, weighted with ATUS final weights. Caregivers are respondents who gave unpaid eldercare more than once in the three to four months before the interview.