
Exploring Alternative Measures to GDP
January 5, 2022
How Record Levels of Inflation Curbed Plant-Based Meat Alternatives
June 28, 2022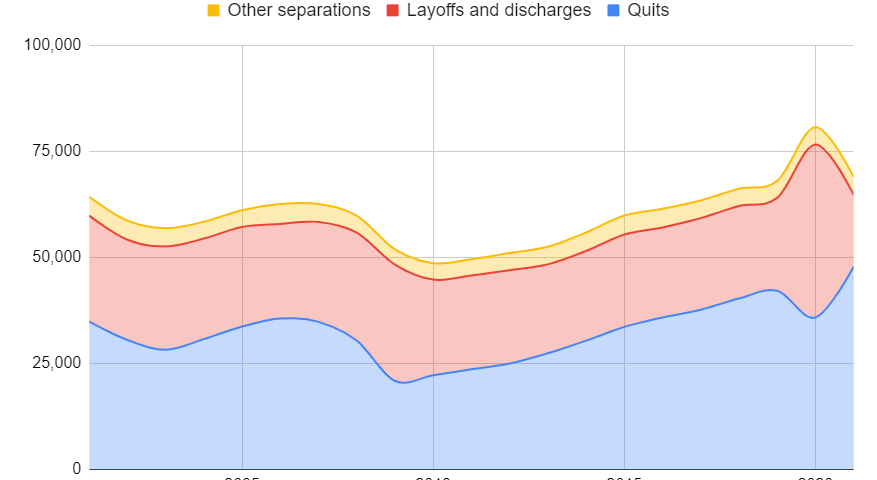
In employment-related lawsuits such as wrongful termination, discrimination, retaliation, etc., expert economists estimate the expected lifetime lost earnings of an employee, who was allegedly terminated for a wrongful cause. Proper estimations account for the expected loss of lifetime income for the employee, which is attributable to the underlying alleged misconduct.
One of the key aspects of estimating the lost earnings properly is to identify all future sources of job separation uncertainties that are unrelated to the alleged wrongful termination so that the estimated lost earnings actually and only relate to the underlying liability of the matter. For example, even in the absence of misconduct, an employee could have chosen to quit their position to look for another job or retire early; or the employer could have gone bankrupt leading to mass layoffs. In such instances, the employee would have lost their position anyways. In either of these cases, employment would have ended independently of the underlying liability, hence the probability of such events needs to be accounted for when computing the lost earnings.

Surprisingly, there is little consensus among forensic economists on the methodologies to estimate these sources of uncertainties. 1 Because there is no widely accepted standard way of doing so, many economists take shortcuts, leading to imprecise outcomes such as underestimating total risks due to omitted separation factors or overestimating them due to double counting. For example, worklife expectancy is a concept of how long an employee will be expected to remain in the labor force, and job separation is an event of ending an employer-employee relationship due to many factors that might result in both switching to unemployment and getting out of the labor force. Since there is a clear overlap, a careful analysis is crucial.
In an ideal world of unlimited data, probabilities of all these uncertainties would be available and taken into account separately, and a correct calculation could be done by discounting for all these factors at each age of the employee. However, this is impossible in general, mostly stemming from the unavailability of granular level data that would represent the employee and/or the employer. Even at times when such data exists, it might be implausible to prepare such calculations for presentation at the court because it would require a very time-consuming analysis which in turn makes the expert service unaffordable. Pragmatically, the complexity associated with the ideal computations would likely be suboptimal for court presentations, due to the complexity of such calculations. For example, the probability of death never reaches zero until the age of 120 years according to the mortality tables,2 and presenting discount rates for those years might seem counterintuitive in the eyes of the jury.
ESTIMATING WORKLIFE EXPECTANCY
In fact, many expert economists estimate lost earnings by using deterministic approximations of uncertainties regarding retirement, death, etc. For example, when calculating worklife expectancy, forensic economists widely use Skoog et al. (2011),3 which provides stochastic and deterministic worklife tables for men and women with different education levels and at different ages, constructed by using the Current Population Survey (CPS), the primary source of labor force statistics for the population of the United States.4 Experts typically utilize those worklife tables which take into account the probability of retirement, death, and disability, and have an estimate of when the Plaintiff would go out of the labor force.
One practical alternative would be to fix the remaining worklife of the Plaintiff deterministically by using the Social Security Administration (SSA) full retirement age table.5 Once the retirement age is fixed, life tables provided by the SSA can be used for the survival rates of the employee with respect to age and gender.6 Finally, for disability probabilities, the American Community Survey (ACS) data provides disability rates and employment ratio of disabled persons in the US. By calculating probabilities of death and disability this way, experts can discount such risks when calculating total compensation.
UNEMPLOYMENT
Once the concept of labor force participation is determined, the next step is to estimate the likelihood of job separation due to quits, layoffs and discharges, i.e. transitioning to unemployment due to reasons that are unrelated to the misconduct. This is a necessary step but it is often overlooked in employment lawsuit computations. To put it another way, even when accounting for the probability of survival and retirement, the risk of termination of an employee-employer relationship should be taken into account due to the leave of the employee, either voluntarily, such as for a better job elsewhere (quits), or involuntarily, such as for getting fired with cause at a later date or laid off (layoffs and discharges). 7
Employee-employer specific risks are also affected by a variety of factors including demographics, job position, industry (sectoral risks), and the tenure factor, i.e. how many years the employee has been employed for that particular employer, at the time of alleged misconduct.8 The most comprehensive data source to calculate such risks jointly is the CPS data. It is a very detailed panel dataset (each individual was surveyed 8 times over a 16 month period) and one can filter it for location, demographics, employment status, and tenure,9 industry and occupation, and estimate such risks for employees similar to the Plaintiff.
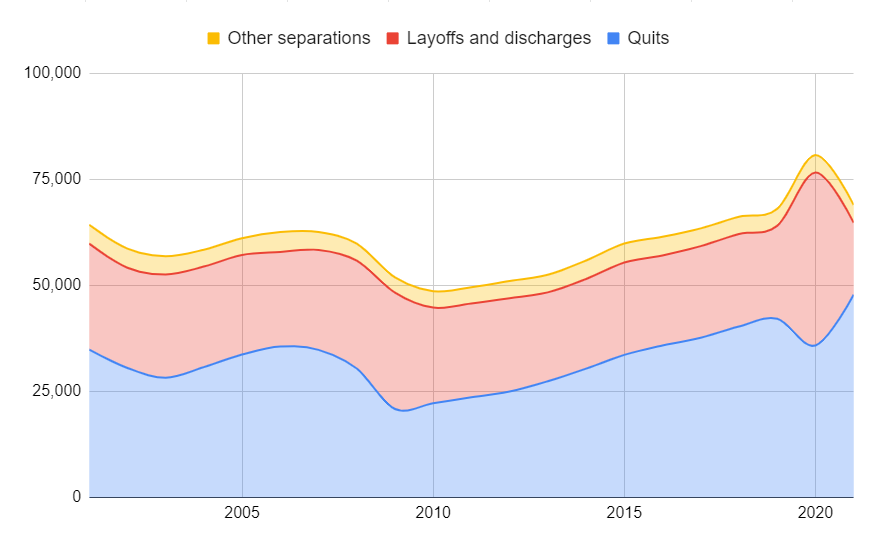
However, CPS data might be limited when multiple categorical filters are used jointly, leading to small sample sizes, and violating the representability of the analysis. A good alternative is to use JOLTS data published by the BLS, which is constructed by using CPS data.10 JOLTS data provides all separations in a semi-aggregated fashion, for major industries only, by type of separation, quits, layoffs and discharges, and other separations such as retirements, transfers to other locations, separations due to employee disability, and deaths. Since death, retirement, and disability are already taken into account when considering the expected retirement age, such risks should be removed from the total discount factor in order to avoid double-counting, and only quits and, layoffs and discharges rates in JOLTS data should be used rather than the total separation rates.
There are many shortcomings of relying only on the JOLTS data, however. JOLTS data categorize industries broadly and do not provide estimates for detailed level sectors. This could lead to an inaccurate assessment of risk factors in general when we consider the fact that sectoral risks may differ significantly within broader categories of industries. Moreover, JOLTS does not allow filtering for demographics or tenure status either, requiring externally controlling for such factors using other aggregations of CPS data (which in itself is statistically challenging, due to the limited sample issue mentioned above, hitting the degree of freedom problem once again). For that reason, some of the external adjustments should best be estimated using other (non-CPS sourced) databases, in order not to violate basic statistical principles.
For example, when adjusting for company-specific financial risks (which is one of the largest drivers of layoffs and discharges), instead of using the sector as a filter variable in CPS, one could use the weighted average cost of capital (WACC). In case WACC rates are not found for the particular employer, a good proxy would be publicly available industry-specific WACC rates.11 On the other hand, in order to avoid double-counting, one needs to factor out total market risk from sector WACC because it is already discounted for job separation rates above which are estimated for the whole US economy. The remaining sector-specific risk is a proxy for the inability of the employer company to pay future salaries.
IAMECON was founded by Dr. Devrim Ikizler who, with over 10 years of experience in the field, has led the team in many employment lawsuits. Contact us to learn more about our expert witness services.
- David Schap, Michael R. Luthy, and David I. Rosenbaum. 2020. A 2019 Survey of Forensic Experts: Their Methods, Estimates, and Perspectives. Journal of Legal Economics 26(1etc: pp. 23–69.
- Bureau of Labor Statistics (BLS) data shows that the labor force participation rate for 75 and older is 8.9% in 2020. https://www.bls.gov/opub/ted/2021/number-of-people-75-and-older-in-the-labor-force-is-expected-to-grow-96-5-percent-by-2030.htm
- Skoog, G. R., Ciecka, J. E., & Krueger, K. V. (2011). The Markov Process Model of Labor Force Activity: Extended Tables of Central Tendency, Shape, Percentile Points, and Bootstrap Standard Errors. Journal of Forensic Economics, 22(2), 165–229. http://www.jstor.org/stable/42756301
- CPS is sponsored jointly by the U.S. Census Bureau and the BLS.
- https://www.ssa.gov/benefits/retirement/planner/agereduction.html
- https://www.ssa.gov/oact/STATS/table4c6.html
- See Baum(2013). Baum, C. L. (2013). Employee tenure and economic losses in wrongful termination cases. Journal of Forensic Economics, 24(1), 41-66.
- https://www.bls.gov/news.release/tenure.toc.htm
- Tenure data is only available in the supplemental module of CPS, which has been conducted biennially in January.
- Quits data are at https://www.bls.gov/news.release/jolts.t04.htm and layoffs and discharges data are at https://www.bls.gov/news.release/jolts.t05.htm
- See https://www.morningstar.com/, https://pages.stern.nyu.edu/~adamodar/New_Home_Page/datafile/wacc.html
